First they called it the year without a winter. Then springtime began to feel more like summer for most of North America. March 2012 saw thousands of daily temperature records fall in the contiguous United States (often called the “lower 48”), and the entire month was the warmest March in a temperature record that dates back to 1895.
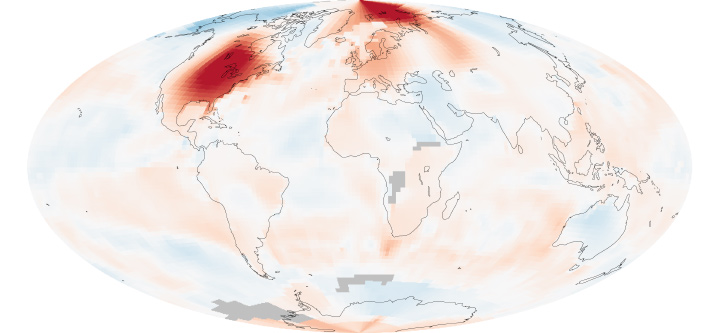
The map above shows global temperature anomalies for March 2012, based on an ongoing analysis by scientists at NASA’s Goddard Institute for Space Studies. It shows changes from the norm for each region, not absolute temperatures. That is, the map depicts how much temperatures rose above or below the average March temperatures for that area compared to the base period of 1951-1980.
For the month, the eastern two-thirds of the United States, as well as the Canadian provinces of Ontario, Quebec, and Manitoba, saw temperatures in the GISS map approaching as much as 10 degrees Celisius (18 degrees Fahrenheit) above normal (deepest reds on the map). Temperatures were similarly extreme in the Arctic Ocean around Svalbard, the Barents Sea, and the Kara Sea. Far eastern Siberia, Alaska, and northwestern North America were significantly colder, while much of Europe and western Russia were warmer than normal (following a much colder February).
According to an analysis by the National Oceanic and Atmospheric Administration, the average March temperature was 10.6 degrees C (51.1 degrees F) for the 48 contiguous states, which was 4.8 degrees C (8.6 degrees F) above the 20th century average for March. “Of the more than 1,400 months that have passed since the U.S. record began,” NOAA climatologists wrote, “only one month (January 2006) has seen a larger departure from its average temperature than March 2012.”
East of the Rocky Mountains, 25 states had their warmest March on record; 15 more states were in their top ten warmest. More than 15,000 temperature records were broken—evenly split between daytime highs and nighttime highs—and there were 21 instances where nighttime low temperatures were warmer than the former daytime records.
You can view and download global temperature anomaly images (updated monthly) on NASA Earth Observations. To see the trends in global temperatures over the past 130 years, visit World of Change: Global Temperatures. More

